Where the series stands
This is part 6 of a series about the last mile of robot control: how a goal reaches a servo and what the arm does with it.
- Part 1 writes one joint as one equation. Gravity, friction, a payload, dead time and a dead band are each one way the arm misses its target.
- Part 2 is about the sensor: why differences of encoder ticks explode the noise, and how a filter can estimate an angle finer than one tick.
- Part 3 writes every controller I built as one formula for the goal, from a plain look-ahead to MPC.
- Part 4 asks where a neural network fits: a network that learns only what the physics model gets wrong.
- Part 5 builds a pen holder, so that the arm's error shows up as ink.
Those parts measured the arm in joint angles. This part measures it where it matters, at the pen tip, and it starts with what the joint sensors cannot tell me.
The limits of the encoders
My SO-101 arm measures each joint with an encoder. An encoder reads a joint angle in whole steps called ticks. The first joint, the shoulder pan, turns the whole arm about a vertical axis. One tick of the pan is mrad. The pen is 231 mm from the pan axis, so one tick moves the pen 0.354 mm.
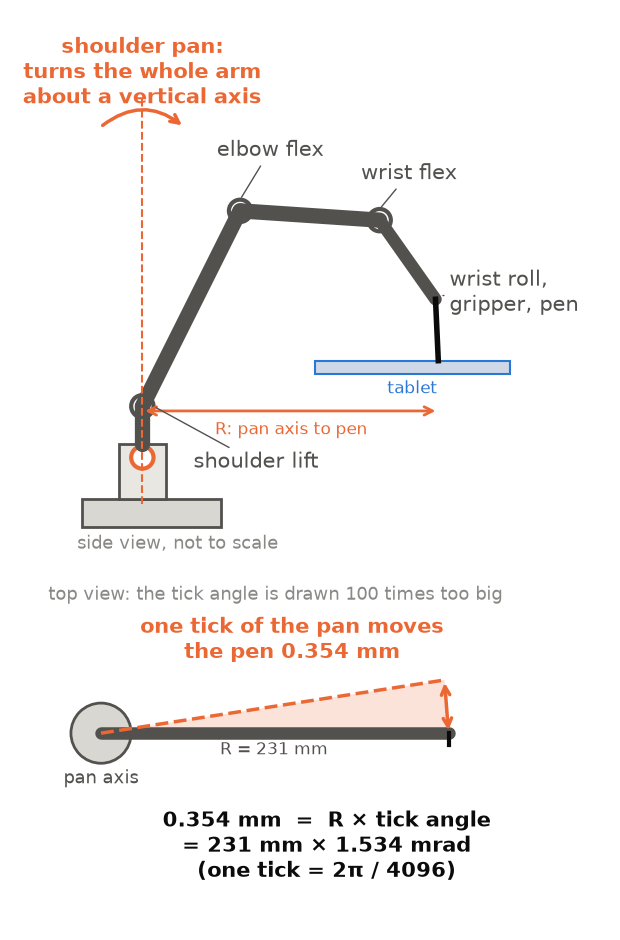
So the encoder is a coarse ruler at the pen. Rounding alone gives up to ±0.18 mm of error, and about 0.10 mm RMS. The controller can only command whole ticks. This is the first limit, and it is not the worst one.
What goes wrong in the servos
- Friction sets the floor today. The pan holds a goal only within about 2.6 ticks, which is about 0.9 mm at the pen. At the servo gain setting P32, it does not move at all for steps of 10 ticks or less (Measured, 11 Oct).
- A firmware dead zone of about 1.5 ticks (2.3 mrad) sits inside the servo.
- A delay of 20 to 25 ms separates the joint from the controller, which runs at 60 Hz.
- Gravity and the gain make a held joint sag: the servo needs a steady gap between goal and angle to carry a load.
- Heat weakens the motor.
What the encoders cannot see
- Between two ticks, they say nothing.
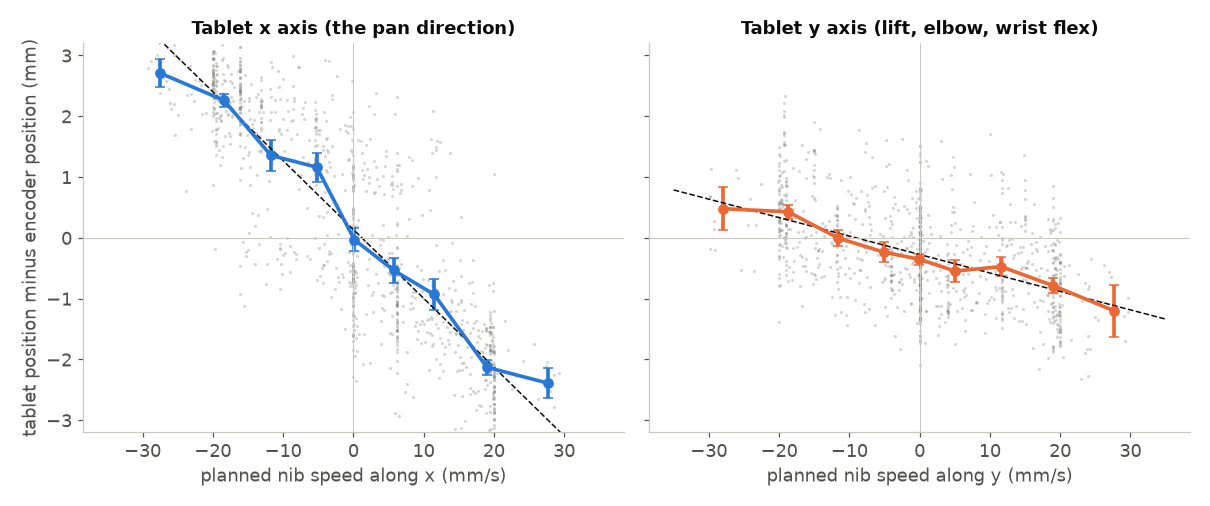
- A slow gap opens between the joint angles and the real pen position. The pen lags 86 ms behind the encoder reading along the pan direction, with a direction offset and a position error on top. Play and bending outside the servo, in the base, the table or the pen holder, hide here.
- Backlash inside the servo is small. The encoder sits on the output shaft (project notes, not checked against a datasheet), so the loop sees about 1 mrad of it or less.
Where my model and my simulator are wrong
The physics controller from parts 3 and 4 and my simulator share one model of the arm. It contains friction, gravity and motor terms, the delays and the firmware dead zone. It does not contain these things.
- Backlash. There is no backlash term.
- Compliance. The base, the table and the holder can bend. The model treats them as rigid.
- The real pan friction. The pan needs a much larger force to start moving than to keep moving. A single friction value misses that, so the model underestimates the late start of the pan.
The error shows up as a gap. When the model predicts 10 ticks ahead (about 0.17 s), its error at the pen is 1.81 mm, larger than the tracking error that it tries to fix (1.24 mm). A simulator built from this model inherits the same blind spots. To make it better, I would have to model every defect of every joint.
The shaking
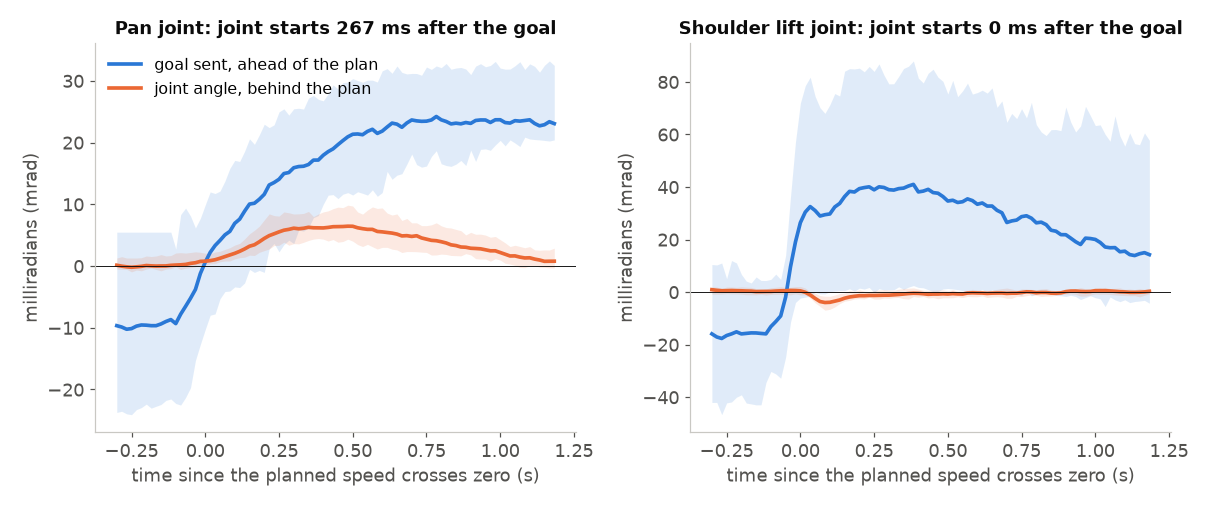
The shaking that I see on the arm is mostly the controller's own goal chatter. It excites a mode of the shoulder lift at about 4.3 to 4.5 Hz (Offline). In the figure, the goal that the controller sends to the lift servo swings by up to 20 mrad in a 2.5 s window, and the joint answers with about 2 mrad, which is one to two ticks.
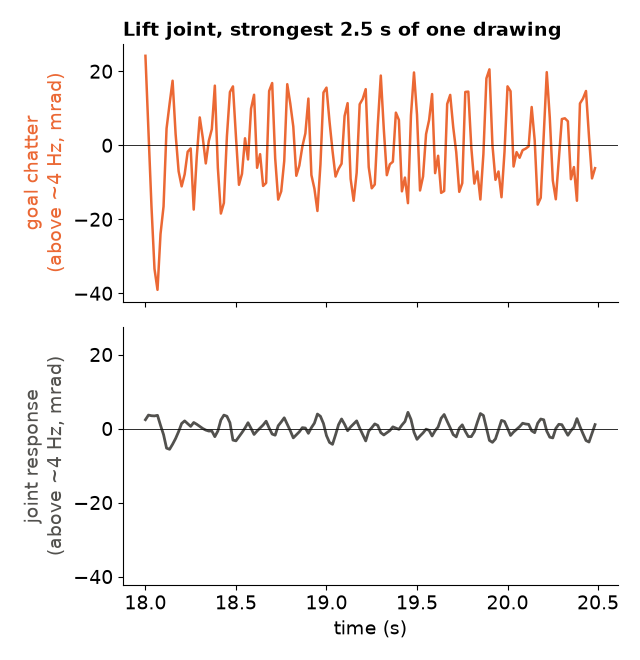
The encoders see this shaking. In an Offline study of tablet and encoder logs, the tablet showed nothing that the encoders miss between 2 and 12 Hz, and the ring after a stop was about one encoder tick. So the shaking is a controller problem, and it is not hidden from the sensor.
I also filmed it. The gripper camera rides on the arm, so a shake of the arm would shake the picture. I recorded the kitten twice: with the correction head on (v6c) and with it off. My prediction was a visible shake with the head off and less with the head on. The clips do not show that.
I measured the picture instead of trusting my eyes. For each frame, I computed how far the picture moved against the previous frame, and removed the slow drawing motion (below 2 Hz). Over 70 s of each clip, the remaining motion is 0.25 px RMS with the head off and 0.28 px RMS with it on (Measured, 960 px wide pictures at 30 frames per second). Neither spectrum has a peak at 4 to 5 Hz.
So these clips do not show the lift shaking. They do not contradict the Offline result either. The camera is a wide-angle lens at 30 frames per second, and the joint answers the chatter with only one to two ticks. A shake that small may be below what this camera shows. An accelerometer on the arm is a better test, and it is on the list below.
So I need an outside judge
What the encoders miss is mostly slow: the lag, the offset, and the position error of the pen. To measure that, I need a second opinion on where the pen tip is. A tablet gives one.
Why a tablet?
A tablet reports where a pen touches it. It was the cheapest outside judge of the pen tip that I could find. If the arm draws a path that I know exactly, the tablet tells me, moment by moment, how far the pen is from where it should be.
There are better judges. Three strings attached to the pen tip, one for each axis, could measure the 3D position. A very precise camera could too. I did not build either one.
All three have the same problem for a fleet of robots: nobody will calibrate every robot every day with strings, a camera rig or a tablet. So the tablet is a stepping stone. It labels where the pen really went, so that I can learn what a cheap on-board sensor must see. My next candidate is an accelerometer on the arm.
The goal behind all this: my arm will do kitting and carry tools. These are 3D motions with a payload that changes. The final controller can use only what the arm carries. So I want to know how accurate a cheap arm can be, which controller ideas make it better, and which physical effects set the limit.
The question of this part: my arm draws with about 1 mm of error. Where does the rest come from, and which controller ideas reduced it?
Short on time? Watch the time-lapse, look at the drawings, and read the five findings. The long parts are in closed drawers.
The drawings
This is the same kitten, drawn by the real arm with four controllers. Gray is the reference line. The colored line is where the pen really went, as measured by the tablet. The number is the error of the whole drawing: the root mean square (RMS) distance between the pen and the line, in millimeters. Square each error, average, take the root. Big misses count more.
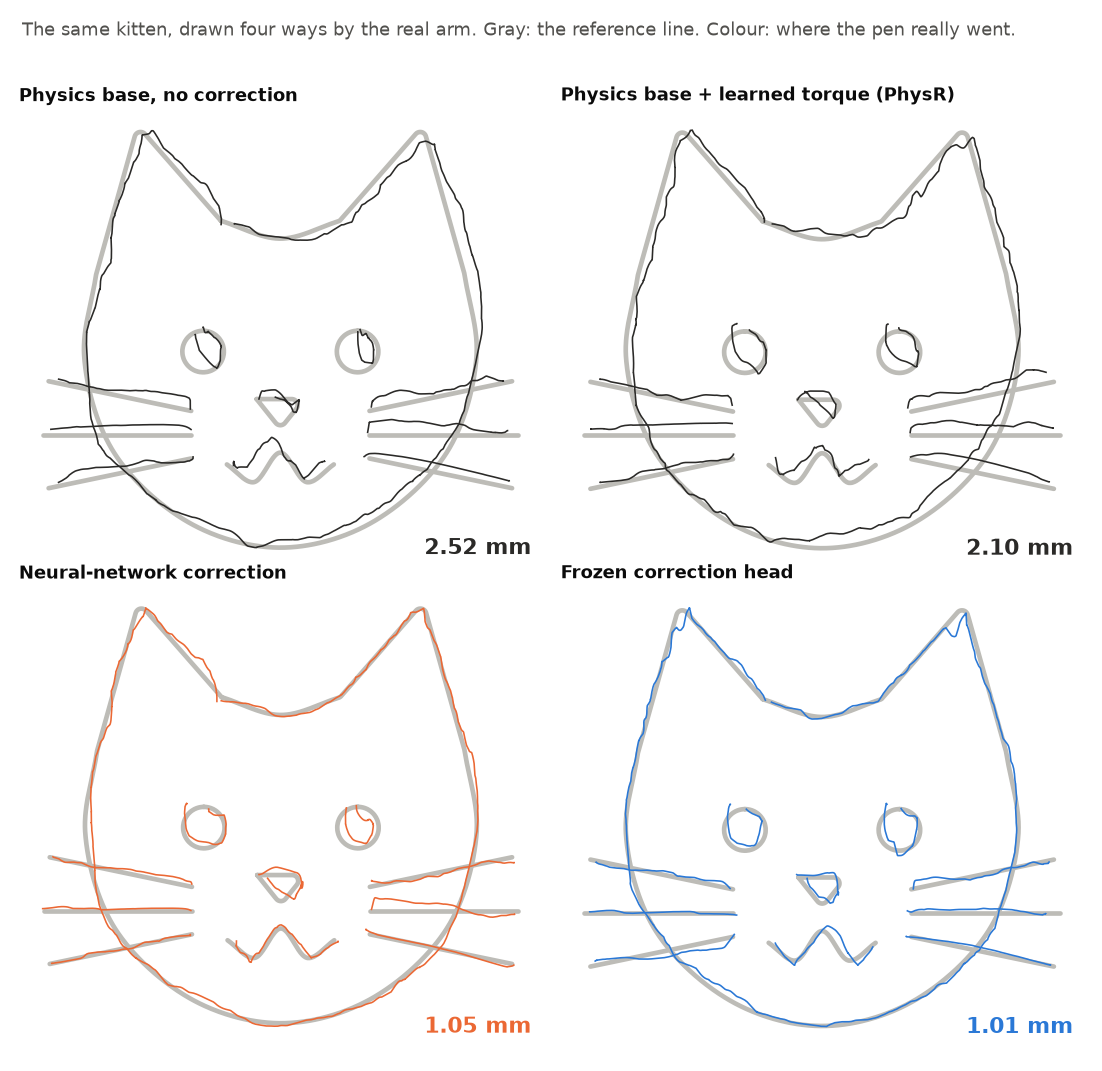
The top two drawings show the problem: the pen trails behind the line and wanders off it. The bottom two show a learned correction: the pen follows the line.
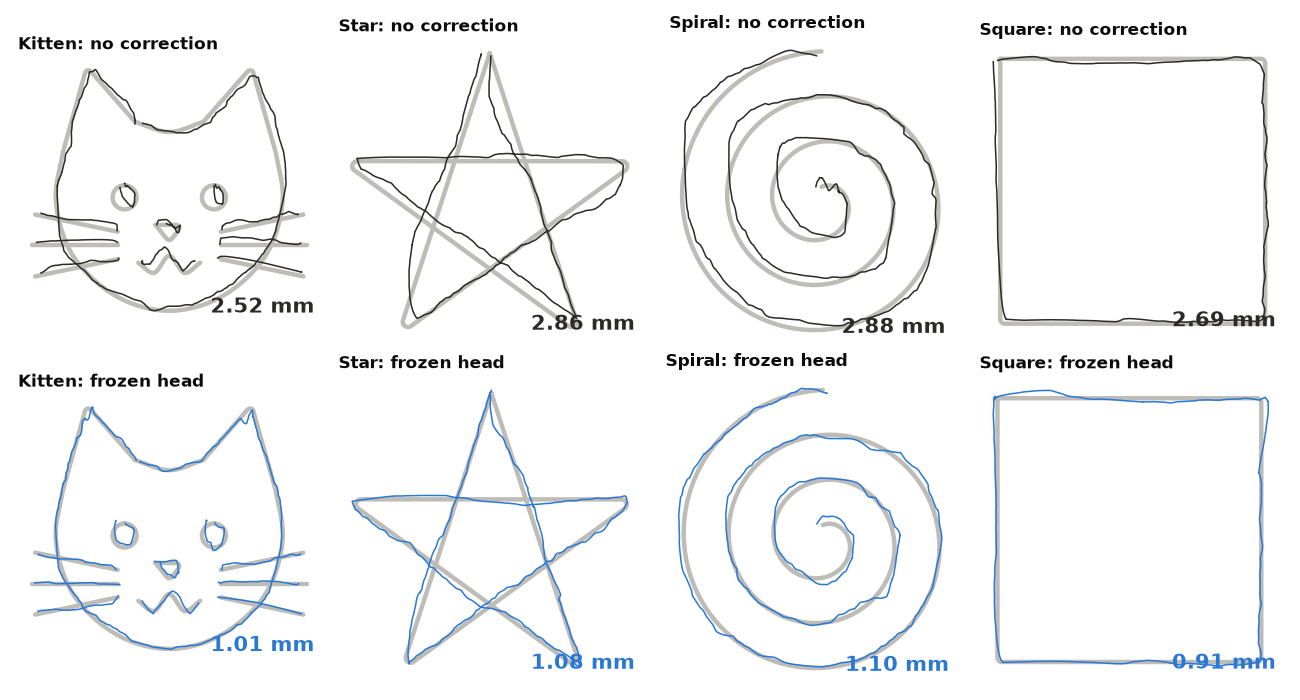
I use two sets of drawings. The test drawings (kitten, star, spiral, square) are the ones I choose controllers on. The validation drawings (circle, plus) are held out and only report how well a controller generalizes. Every number in this part is on the test drawings unless it says otherwise. I have not scored the validation drawings here.
Time-lapse: the drawings get more precise
The video draws all four test drawings at once, with four controllers in a row. Each stage is the real arm, drawn again from the tablet recording at 8 times speed. The bars on the right keep the error of every stage. The four stages ran the same night, at the same tablet pose. They are ordered by error and not by clock time.
Before the tablet: the arm in the camera view
Before I had the tablet, I measured the pen with an overhead camera. This clip is real camera footage from 6 Oct. A pencil taped in the gripper hovers over a circle, with no contact. A grid is drawn over the table for scale. The left half is the default controller, direct, which sends the target angle unchanged. The right half is the physics controller. Purple is the pen trace that the camera sees. After 67 s, the error so far is 10.1 mm for direct and 1.3 mm for the physics controller (Measured with the camera, not with the tablet).
How the system works
The input is a drawing: a path in tablet millimeters. The output is where the pen tip really goes. The diagram shows the parts in between. The tablet is lab only. A correction can happen in three places.
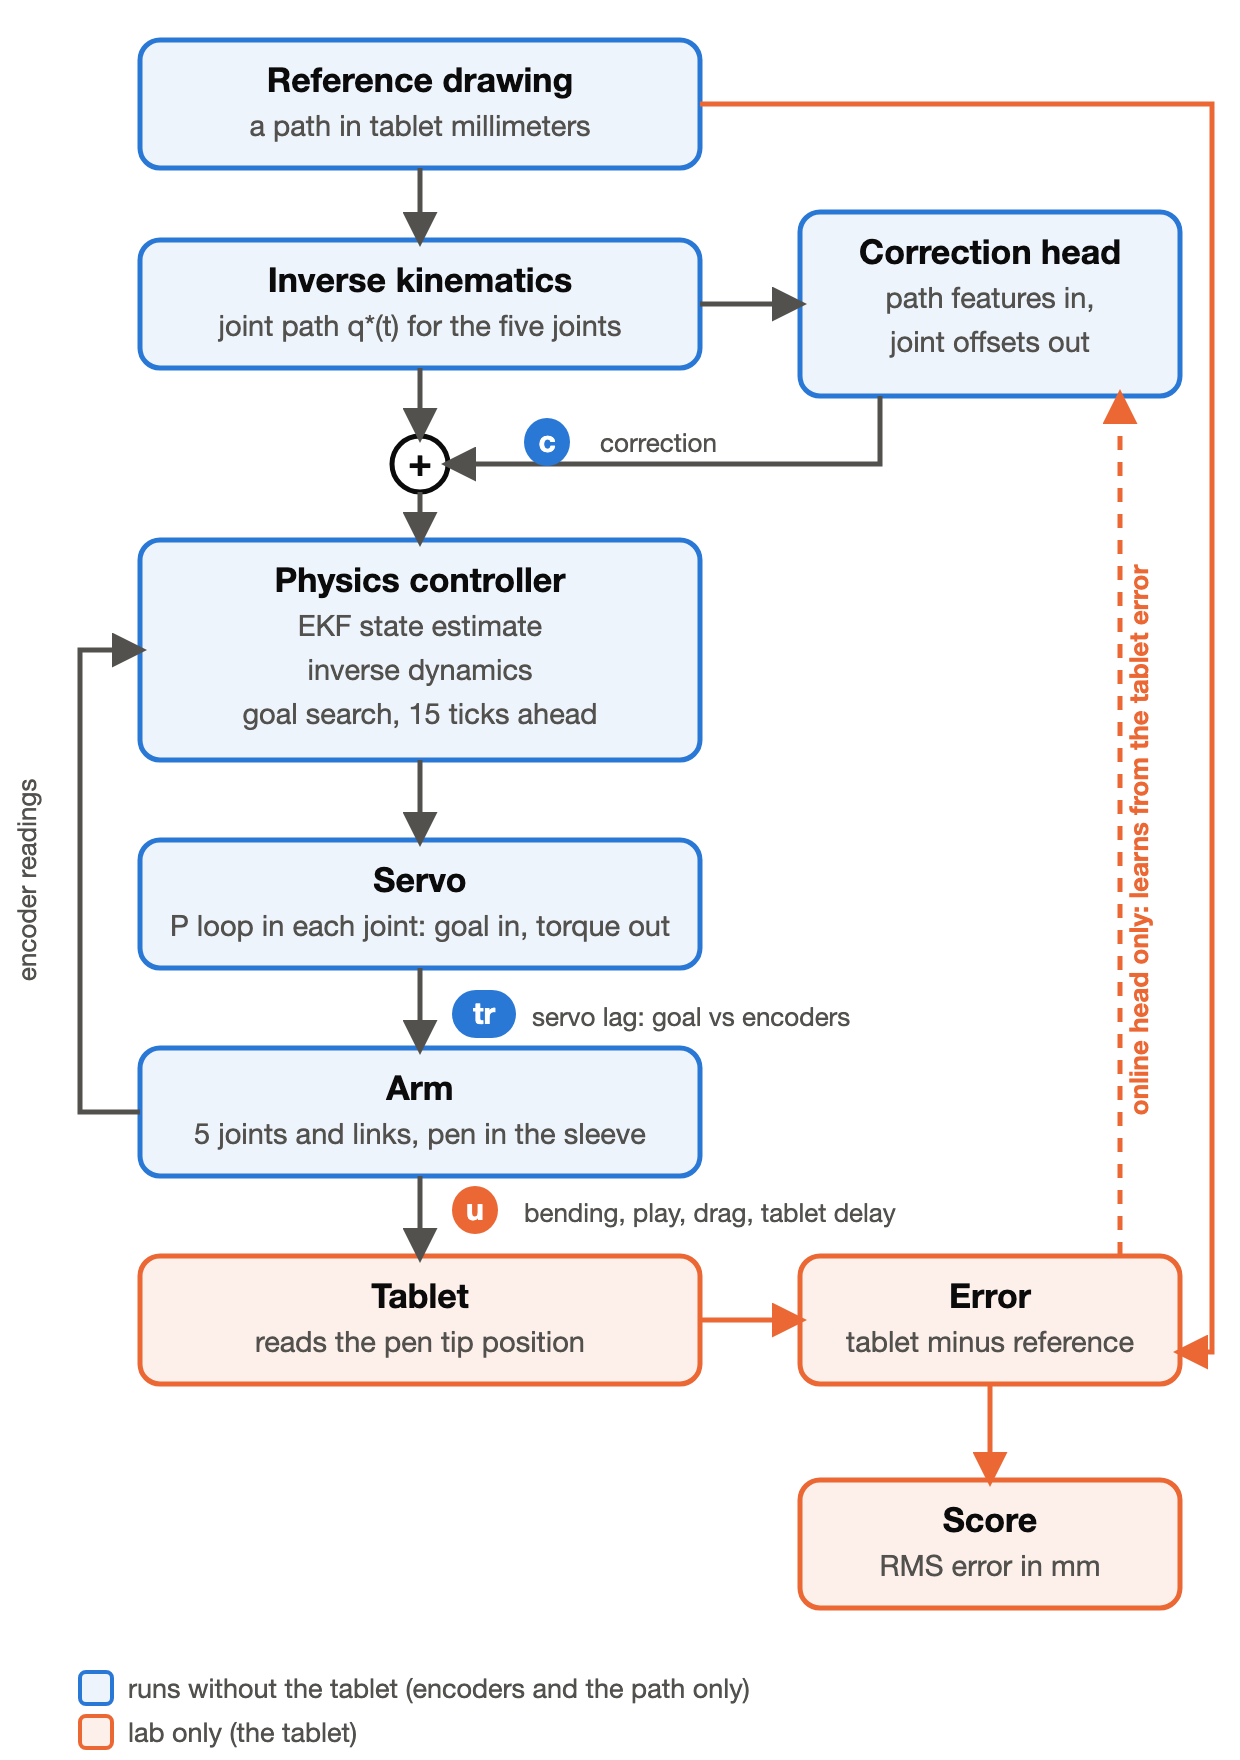
- Inside the physics controller. It predicts the torque that the path needs and picks the best goal for the next 15 ticks (about 0.25 s). A learned torque (PhysR) is one more correction here.
- On the path, before the controller: the correction head. It adds joint offsets that were learned from features of the planned path.
- From the tablet error: the online head. The head learns from the tablet while the arm draws. This needs the tablet. I freeze the head before I use it, so that it needs only the path.
The correction head
The head is a small linear map. The input is the planned joint path. The output is a few milliradians of offset for each joint, added to the goals. The head exists to stand in for effects that the physical model does not contain.
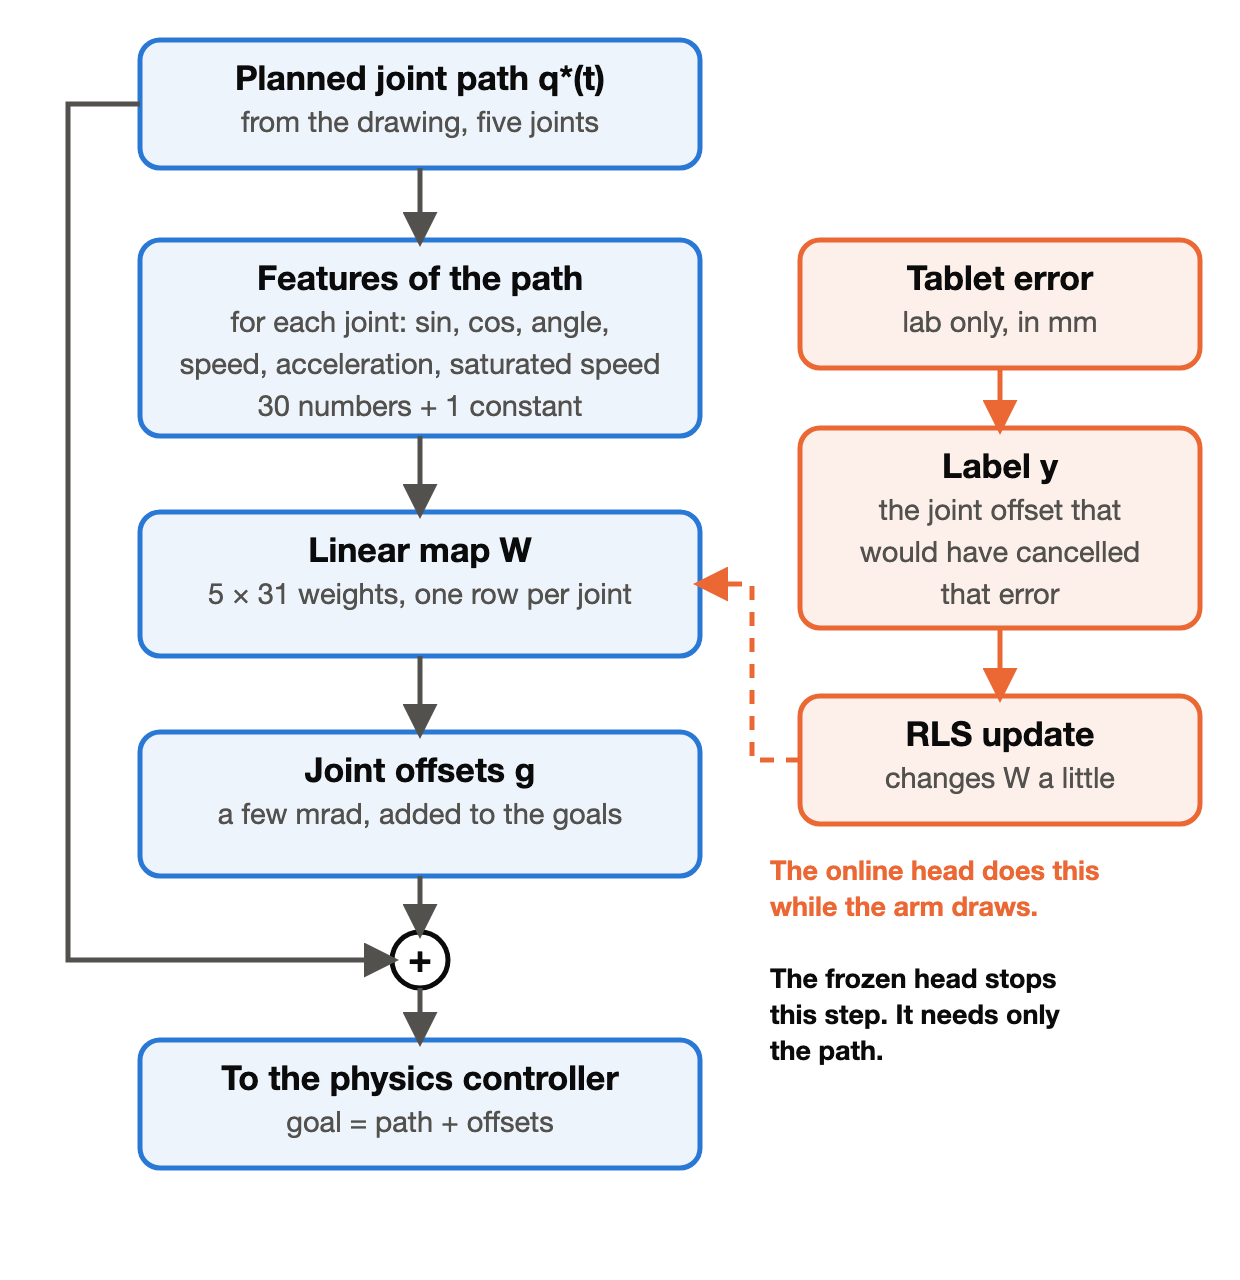
This is what the frozen head adds to the pan goal while the arm draws the kitten.
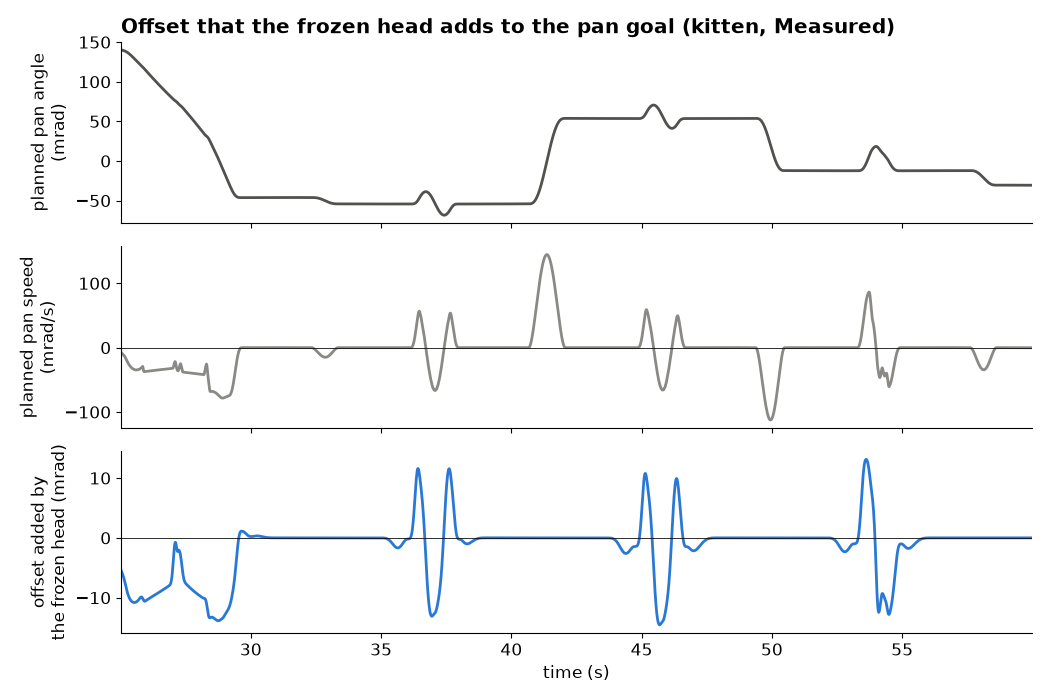
The offset is near zero while the pan holds or moves smoothly, and it spikes by 10 to 14 mrad around quick back-and-forth moves. This matches the weak spot of the pan: it starts late after a reversal, so the head asks for more angle ahead of time.
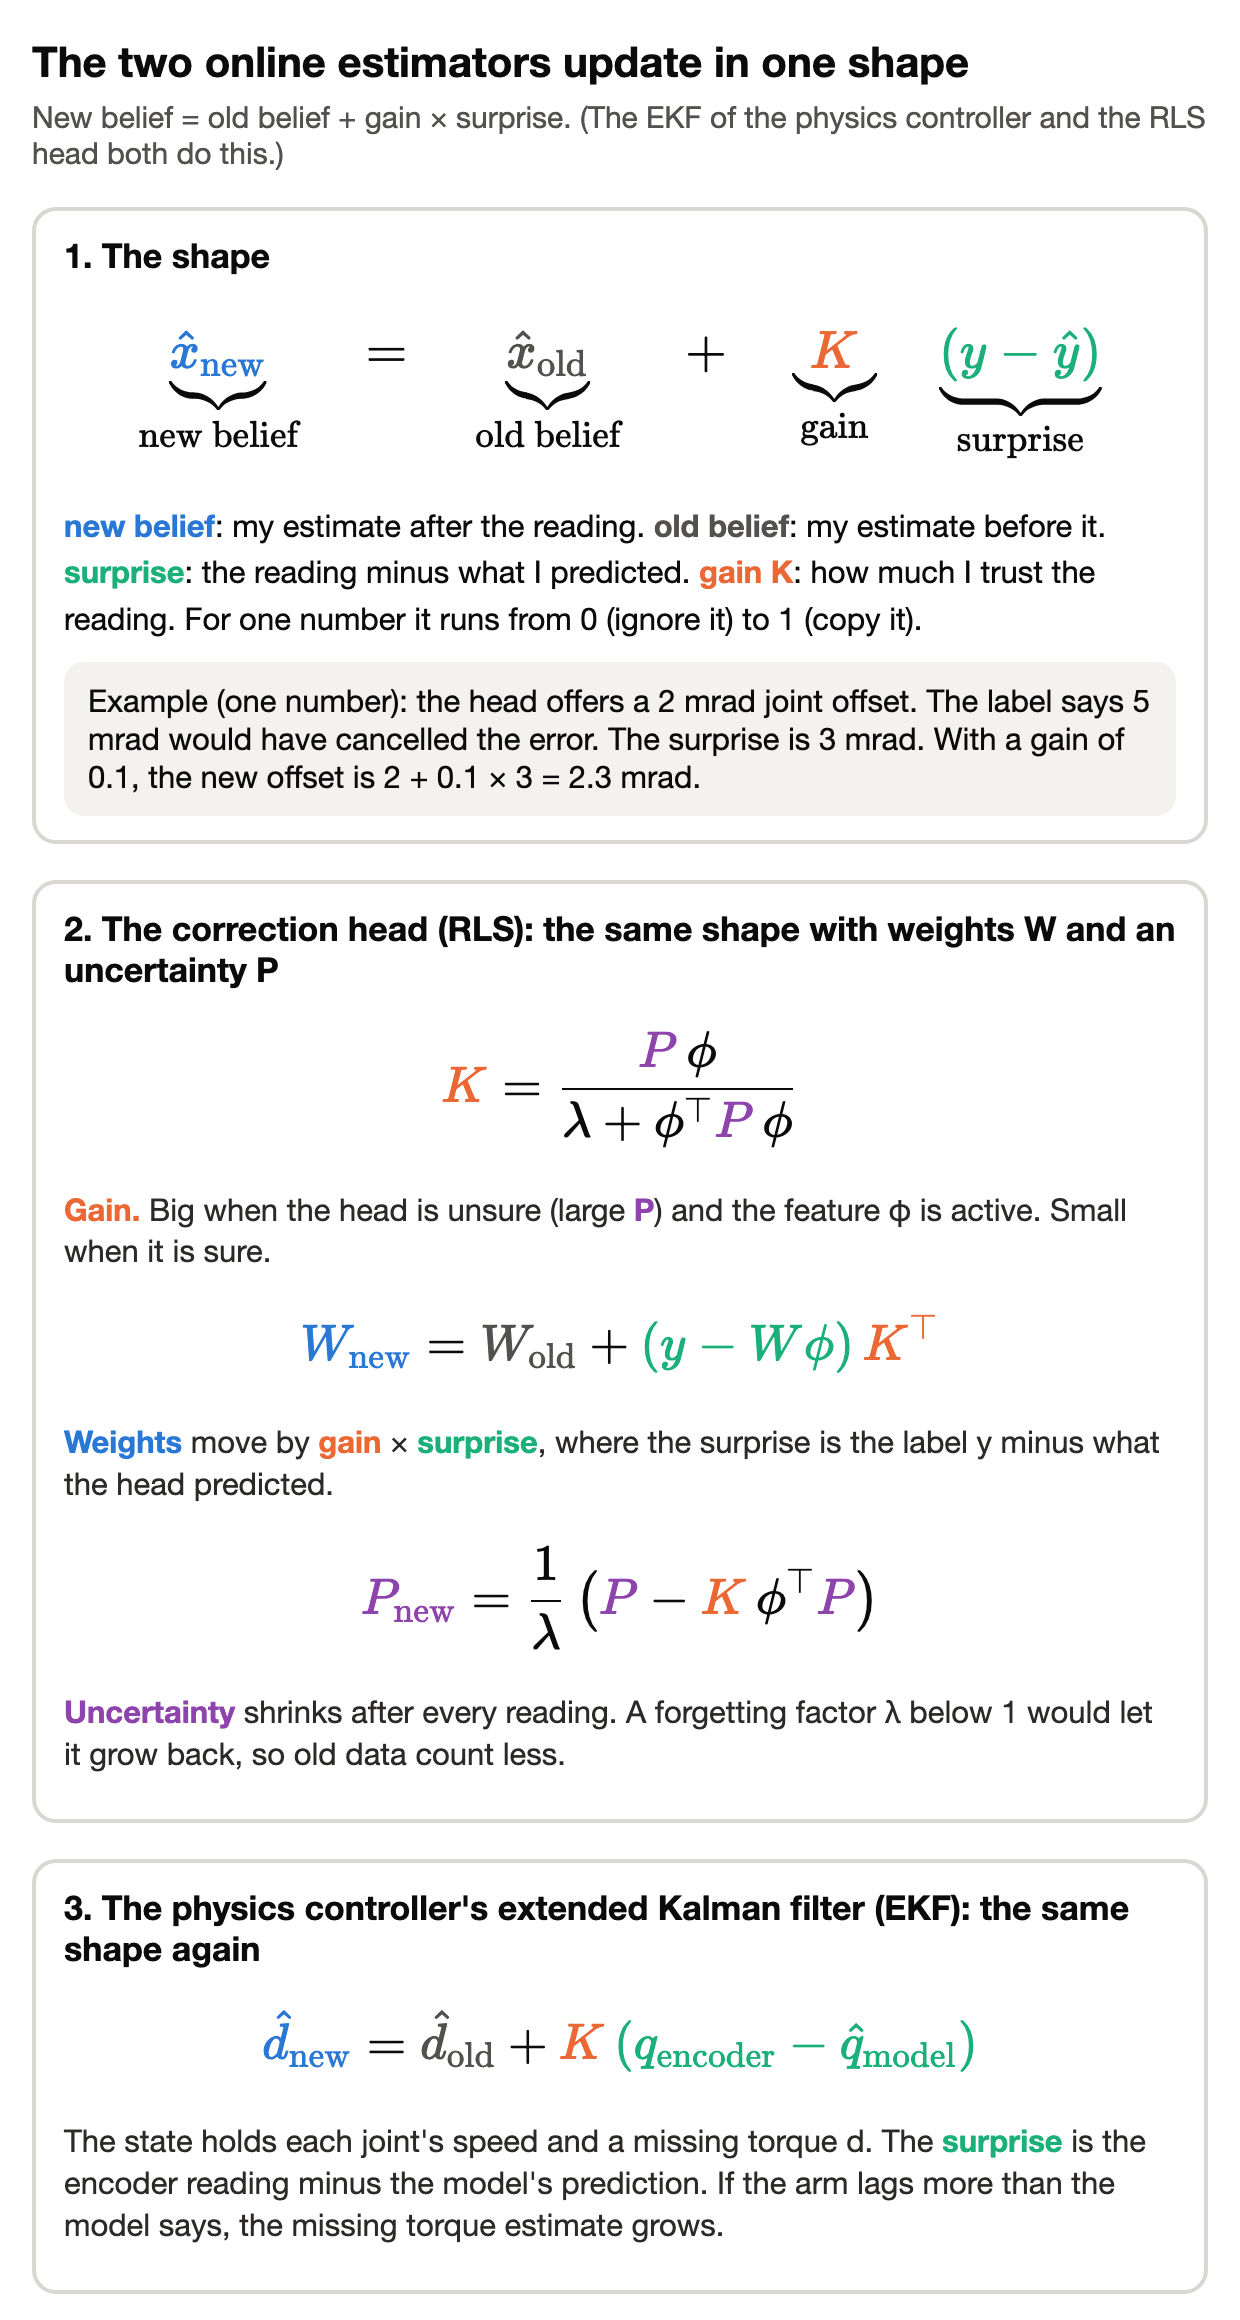
The head learns with recursive least squares (RLS): after each tick, it nudges its weights to shrink the error that the tablet just reported. The physics controller uses an extended Kalman filter (EKF) to estimate a missing torque. Both updates have the same shape: new belief = old belief + gain × surprise. The figure marks each part. The gain says how much to trust the new reading. The matrix says how unsure the learner is. It shrinks after every reading.
What I found
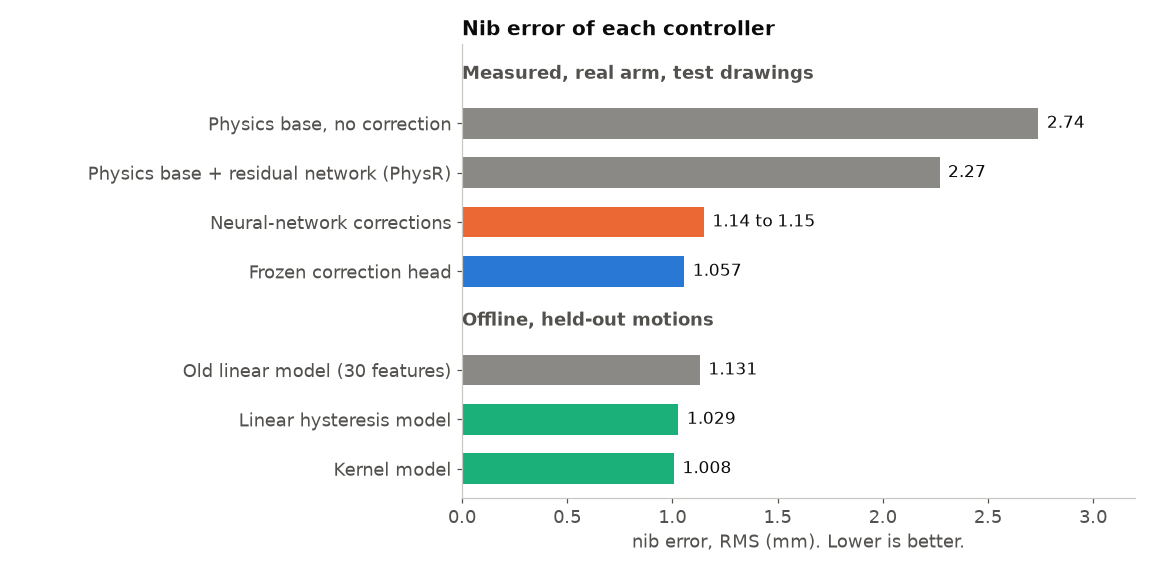
- A learned correction does most of the work. Physics alone gives 2.74 mm. The frozen correction head gives 1.057 mm (Measured, mean of the four test drawings).
- A better torque model alone cannot do it. Even a perfect servo, with zero tracking error, leaves 2.22 mm (Offline).
- The shoulder pan owns 61 % of the squared error of the uncorrected controller. It starts about 267 ms late after each direction change, and the pen lags the encoder reading along the same axis.
- Features beat bigger models. A neural network fits its training drawings to 0.85 mm and gains at most 0.02 mm on new drawings. Features that remember backlash and the last direction helped most (Offline).
- The pan dead band is friction, not backlash. The lag on the pen is still unexplained.
What the physics misses
To find the causes, I remove one cause at a time and measure what is left. This is an error budget. It splits the error into three parts, marked on the system diagram:
- is tracking: where the encoders say the pen is, minus where I told it to go.
- is the gap the encoders cannot see (u for unseen): where the tablet says the pen is, minus where the encoders say.
- is the correction that a head adds. For the uncorrected controller, .
If tracking were perfect, the error would be alone: 2.22 mm. A torque model acts on tracking only, so this is its best case. It stops far above the 1.06 mm of the head.
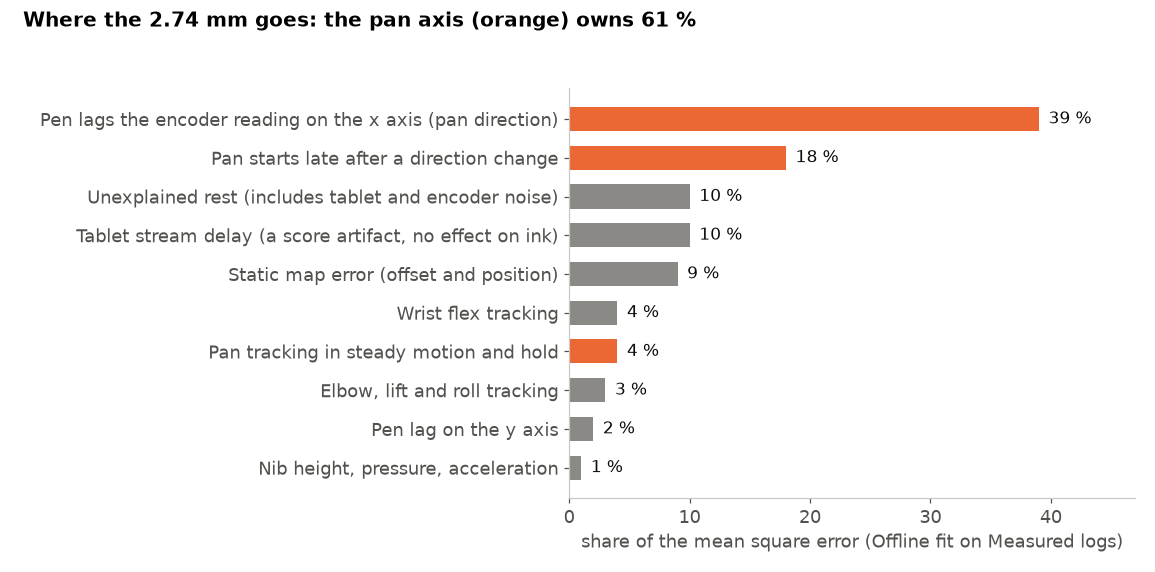
Two bars are not arm errors. The tablet stream delay (about 20 ms) changes the score and not the ink. The unexplained rest holds tablet and encoder noise, about 0.4 mm. If the pan error were gone, the error would fall from 2.74 mm to 1.63 mm (Offline).
The numbers behind the budget
For the uncorrected controller, the mean of the four test drawings gives (Measured, Offline fits):
The cross term exists because and are not independent.
| Part of the error | Own RMS (mm) | Share of |
|---|---|---|
| Pen lag on x beyond the stream delay, plus direction offset (pan axis) | 1.30 | 39 % |
| Pan start and reversal tracking | 0.94 | 18 % |
| Unexplained rest of | 0.97 | 10 % |
| Tablet stream delay (20 ms times the speed) | 0.37 | 10 % |
| Static map (constant, x and y position) | 0.64 | 9 % |
| Wrist flex tracking | 0.56 | 4 % |
| Pan tracking, steady and hold | 0.50 | 4 % |
| Elbow, lift and roll tracking | 0.45 | 3 % |
| Pen lag on y beyond the stream delay | 0.24 | 2 % |
| Nib height, pressure, acceleration | 0.42 | 1 % |
A timing view shows the same story. If I shift the plan 115 ms earlier before I score, the error falls from 2.74 mm to 1.74 mm (Measured). At 20 mm/s, 115 ms is 2.3 mm of path. The frozen head learned this advance.
The pan axis
On my tablet, the pan moves the pen mostly along x. One milliradian of pan angle moves the pen 0.231 mm on x and 0.019 mm on y. The pan has two problems.
It starts late. The planner reverses a goal. The lift and the elbow follow within 50 ms. The pan follows 267 ms later (Measured, median of 46 events), then lags by about 10 mrad. At 0.231 mm per mrad, that is about 2.3 mm of pen.
The pen lags the encoders on x. The gap between the tablet and the encoders grows in a straight line with the pen speed along x. The slope is a lag of 86 ms on x and 35 ms on y.
The dead band is friction (Measured). The cause of the lag on x is not known: compliance and pen drag are suspects, and backlash is small. The drawer has the three tests.
Why does the pan lag? Friction, backlash, compliance and pen drag
Three mechanical causes can make a joint lag.
| Suspect | What it is | What it predicts |
|---|---|---|
| Friction (stiction) | The joint does not move until the servo torque beats a breakaway torque | A dead zone around the goal, and a delay at a start from rest |
| Backlash | A gap between gear teeth. The motor crosses the gap before the joint moves | A fixed-angle gap at each reversal, whatever the torque |
| Compliance | A part bends like a spring: deflection = torque ÷ stiffness. The base, the table or the pen holder can bend | An error that grows with the torque. The encoders cannot see it |
Friction explains the dead band. The servo torque is , where is the servo gain register and is the position error. With friction, the joint moves only when beats the breakaway torque , so the dead band is . Doubling halves it. A backlash gap is an angle that the gears fix, so doubling does not change it. I held the pan at a goal at four values of (Measured, direct holds from older logs):
| Pan dead band (mrad) | Dead band times | |
|---|---|---|
| 4 | 26.2 | about 105 |
| 16 | 9.2 to 9.7 | about 150 |
| 32 | 3.8 to 4.1 | about 125 |
| 128 | 0.04 to 0.13 | near zero, below one encoder tick |
From = 4 to 32, the product stays between 100 and 160. That is the signature of friction. Backlash in the loop is at most about 1 mrad. During drawing, the physics model removes part of the friction: the dead band is only 2.2 mrad, but the start after a pan reversal is still late.
Compliance remains a suspect for the lag on x. The pan load reading predicts the x gap: mm for each 10 % of load. With the load in the fit, the direction offset falls from to mm (Offline fit on Measured logs). But a separate Offline test found that load deflection does not explain the pose-dependent part of the error. So compliance is a suspect, not a result.
Pen drag is a fourth suspect. A pressed pen drags against the motion. The direction offset on x grows with press depth, from −0.44 mm at 0.5 mm press to −1.01 mm at 2.0 mm. It is zero on y and about zero in hover. But 32 to 36 ms of the x lag stays in hover, so drag is not the whole story. A hover replay would decide it. It has not run.
What worked
The physics base is wrong in a repeatable way: 98 % of its error repeats from run to run (2.58 mm repeatable, 0.58 mm random). An error that repeats can be learned. The head's inputs are the sine, cosine, angle, speed, acceleration and a saturated speed of each joint: 30 numbers plus a constant. I ran the same head with fewer inputs (Measured, mean of the test drawings):
| Head | Error (mm) |
|---|---|
| No head | 2.74 |
| Constant offsets only | 2.64 |
| Pose features only | 2.65 |
| All features | 1.03 |
Offsets alone give almost nothing. The speed and acceleration features carry the gain.
Hysteresis features. Hysteresis means that the output depends on the history of the input. A gear with a gap has it: the joint position depends on which way the motor came from. An automated research process, which I will describe in a separate post, found that features of this kind help most.
How the hysteresis features work, and the scores
A play operator is a tiny model of a gap. It keeps a state that stays still while the input moves inside a gap of width , and follows when the input pushes against an edge:
Play operators of several widths, plus the sign of the last motion, give the correction a memory of the backlash state of each joint. I use the word for the features, not as a proven cause: the unexplained part of the gap has the same size when a joint stands still and when it moves.
Models fit on the search motions and scored once on four held-out motions (Offline):
| Model | Search score (mm) | Held-out score (mm) |
|---|---|---|
| Old linear model (30 features) | 1.1766 | 1.1314 |
| Linear hysteresis model | 1.0341 | 1.0285 |
| Kernel model | 0.9852 | 1.0077 |
A kernel model builds many curved features through a similarity function and fits a linear map on top. It adds only 0.02 mm over the linear model on the held-out motions, so the gain comes from the features, not from the model class. These are candidates: none has been tested on the arm.
More data. A learning curve retrains each model on 3 to 12 distinct motions and scores held-out motions (Offline).
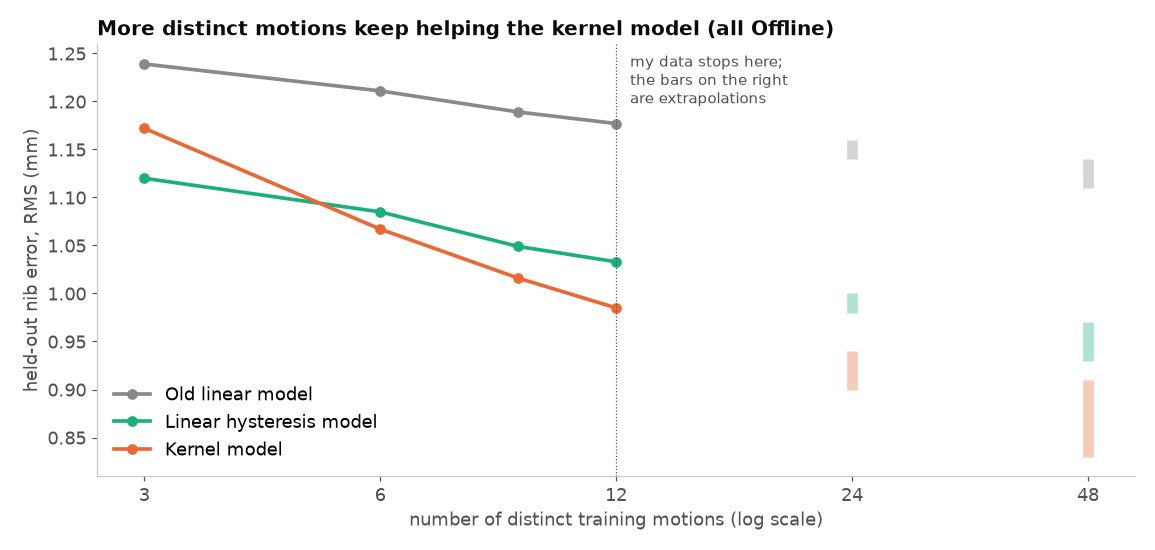
Distinct motions beat repeats. Twelve motions with one run each (12 runs) give 1.039 mm. Six motions with 17.6 runs in total give 1.067 mm.
What did not work
- A bigger neural network. Trained even on the exact test motions, it reached 0.847 mm on those motions. On new motions it beat a ridge model (a linear fit with a penalty on big weights) on the same features by only 0.022 mm: 1.025 against 1.047 mm (Offline). On the arm, two network corrections measured 1.14 to 1.15 mm, worse than the frozen head (Measured). The error that is left on a repeated motion, about 0.5 to 0.6 mm, is specific to that motion. No feature that I tried predicts it on a new motion.
- A better torque model alone. It stops at 2.22 mm in the best case. PhysR measured 2.27 mm.
- Planning the whole drawing at once. At most 5 % better with an exact model, and 23 % to 364 % worse with a small model error (Simulation). The model error grows with the horizon: 0.40 mm at 1 tick and 1.81 mm at 10 ticks, and a plan inherits it.
- A fast Kalman head that follows the tablet error of the last few ticks. It reached 0.74 to 0.84 mm (Offline), but it reads the tablet while it draws, so it is a lab tool. Tuned for no lag, it diverges to 4 to 6 mm if the real lag is 30 ms or more.
- A new shoulder lift servo. Lift tracking owns 0 to 2 % of the error.
Does it transfer?
A reviewer would ask whether this correction is circular. The head learns from the tablet error, and then it is scored by the same tablet. What happens without a tablet, when the arm moves objects in 3D? The answer so far is that I do not know. These are the gaps.
- The head needs the tablet to learn. At run time the frozen head needs only the planned path. But its weights were fit with tablet labels from this arm. They carry this arm's friction, lag and tablet delay.
- The correction lives in the tablet plane. The tablet measures x and y. The scorer removes the pen-height part of the correction. So the head was fit in one plane, at one tablet pose, on one arm. Transfer to 3D motion is untested.
- A payload changes the arm. Kitting changes the payload mid-task. I trained the head with no payload changes. This is untested.
- I chose controllers on the test drawings. So 1.057 mm is a selection-set number. The held-out validation drawings are the fair check, and I have not scored them here.
- The judge has its own error. The datasheet accuracy of the tablet is ±0.25 mm at the center. I have not finished checking it, so a difference below that is weak evidence.
The role of simulation
I also use a simulator. Its value is unclear to me, because every candidate ends up on the real arm anyway. It cannot rank learned models: a simulator built from my model of the arm favors the planner that uses the same model. Its real uses are a dry run before the arm moves, and ideas that need many runs.
The simulator is also flawed, for the reasons in the limits of the encoders above. The defect atlas below is the way to fix it.
What comes next
- A defect atlas of every joint. Estimate every error source of every joint, with a method and an uncertainty for each: backlash, breakaway and running friction, the firmware dead band, compliance, the servo ramp and gain, temperature and drift. This work restarted on 11 October. It starts from the logs that exist, then runs a targeted arm battery for what the logs cannot separate.
- Accelerometers on the arm. Planned, not ordered. An accelerometer sees shaking and bending, so it is a cheap candidate for the unseen gap. Gyros measure the pan rotation rate but not the absolute pan angle, because gravity is vertical.
- A gripper camera over a tag mat, to see the shake and the parasitic motion of the pen tip. This is an idea. It is being scoped offline and is not queued.
- A tilted tablet, to measure height as well as x and y. This is an idea.
- Strings or a precise camera as lab references. This is an idea.
- Servo gain P32. I set P32 on four joints (pan, elbow, wrist flex, wrist roll; the lift stayed at P16). The error was 0.061 mm lower over four pairs of blocks (Measured, standard error 0.015 mm). My pre-written rule still scored it as a loss, because the lift rang past its stop. The lift had P16 in both arms, so the stop did not measure P32. The next test, elbow P32 with wrist flex P48, checks the same direction under a fairer ring rule.
- The held-out drawings. Score the validation drawings, circle and plus, with the best controller.
- The hysteresis models on the arm, with a baseline run before and after each one to cancel drift.
The Mona Lisa test
At the end, the best controller will draw the Mona Lisa. I have not drawn it. It is a demo with many strokes and long reversals, so it should show the pan problems in a picture that anyone can judge. It ranks nothing.
Where the numbers come from
Every number in this part has a label. The diagram shows how each kind of number is made. Only the Measured numbers rank controllers.
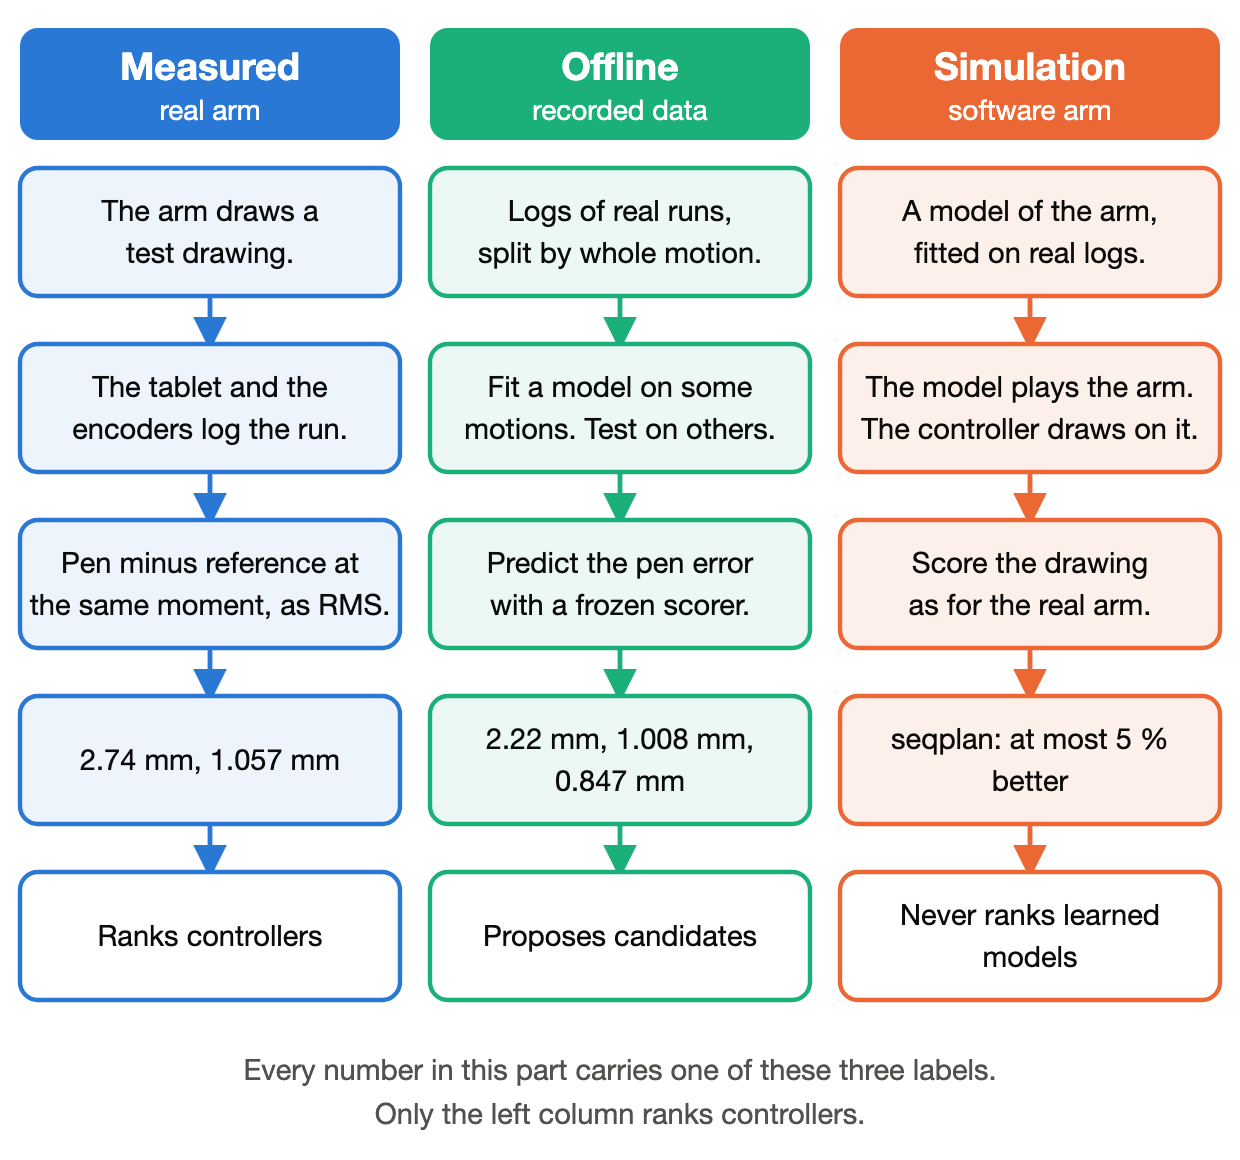
Where each key number comes from
| Number | How I got it |
|---|---|
| 2.74 mm (2.52 for the kitten) | The physics base with no correction draws the four test drawings on the real arm (pen press 1.5 mm, 20 mm/s). RMS of tablet minus plan at the same moment, mean of the four. Measured |
| 1.057 mm | The frozen head draws the same four drawings, in the control block of a baseline, new, baseline test. Measured. Two earlier blocks an hour apart gave 1.03 and 1.14 mm: the same controller drifts by about 0.1 mm |
| 2.27 mm, 1.14 to 1.15 mm | PhysR, and two neural-network corrections played back, on the same four drawings. Measured |
| 2.22 mm | The 2.74 mm runs, recomputed with the tracking error set to zero, so the error is alone. Offline |
| 61 %, and the other shares | Parts of fitted on 44 recorded runs of 10 motions, each fit tested on a motion left out. Offline fits on Measured logs |
| 267 ms | The median delay of the pan after 46 goal reversals in the uncorrected runs. Measured |
| Pan dead band against | Direct holds of the pan from older logs, at four values of the servo gain register . Measured |
| 1.131, 1.029, 1.008 mm | Models fitted on the search motions and scored once on four held-out motions, with a frozen scorer that predicts the nib error from logged runs. Offline |
| 0.847 mm | The same scorer, on the motions that the network trained on. Offline, in-sample |
| Learning curve | Models retrained on 3 to 12 motions and scored on held-out motions. Offline |
| Whole-path planning, at most 5 % | A software copy of the arm built from my model of it, which favors the planner. Simulation |
Check yourself
Each question gives all the facts it needs. The reasoning is in the drawer.
Question 1. The pan axis is 231 mm from the pen. One pan tick is 1.534 mrad. How far does one tick move the pen?
- A. 0.0015 mm
- B. 0.354 mm
- C. 3.54 mm
Answer
B. Arc length = radius × angle = 231 mm × 0.001534 = 0.354 mm. A drops the lever (1.534 mrad is 0.0015 rad), and C is off by a factor of 10.
Question 2. A controller has an error of 2.74 mm. With perfect servo tracking it would be 2.22 mm. Can a better torque model reach 1.0 mm?
- A. Yes, the model can remove all of the error.
- B. No, a torque model acts on tracking only, and 2.22 mm is left.
- C. Yes, if the score noise is 0.12 mm.
Answer
B. With , the error is mm. The encoders cannot see , and a torque model acts only on tracking. A forgets . C compares a 0.12 mm noise with a 1.2 mm gap.
Question 3. A controller measures 1.057 mm, and an hour later 1.14 mm on the same drawings. A new controller scores 1.00 mm in one run. Is it better?
- A. Yes, 1.00 is below 1.057.
- B. Not shown. Run baseline, new, baseline and compare.
- C. No, the second baseline run was 1.14.
Answer
B. The same controller moved by 0.08 mm on its own, more than the 0.057 mm gain. A baseline, new, baseline order puts the drift on both sides of the new run. C compares the wrong numbers: the new run is 1.00, not 1.14.
Question 4. A servo makes torque . A joint with stiction starts to move only when this torque beats a breakaway torque . A second joint has a backlash gap of 3 mrad. You double .
- A. Both effects halve.
- B. The stiction dead zone halves, and the backlash gap stays 3 mrad.
- C. Neither effect changes.
Answer
B. The dead zone is . A gap is an angle that the gears fix. This is why the dead band table points to friction. A real joint can have both, so the drop is then partial.